GEO-DISASTER · INFRASTRUCTURE · COMMUNITIES

Geohazardrisk,quantifiedfrom theground up.

Our platform turns field observations from people on site and nearby into continuously updated risk analysis for landslide, subsidence and ground-movement, so you can see the problem early and act on evidence.

PETOBO, PALU · SENTINEL-2 · 27 SEP → 2 OCT 2018
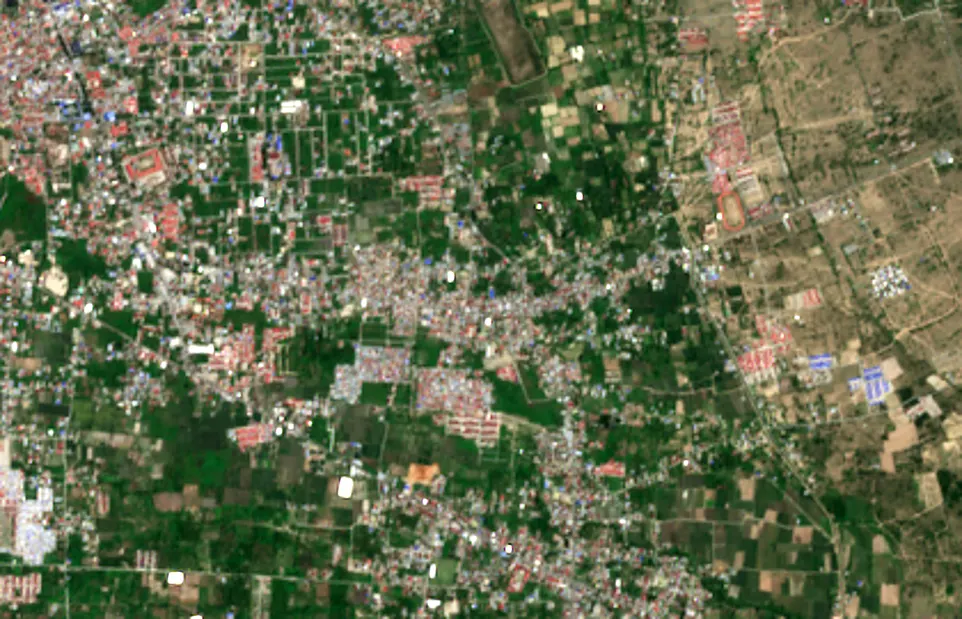
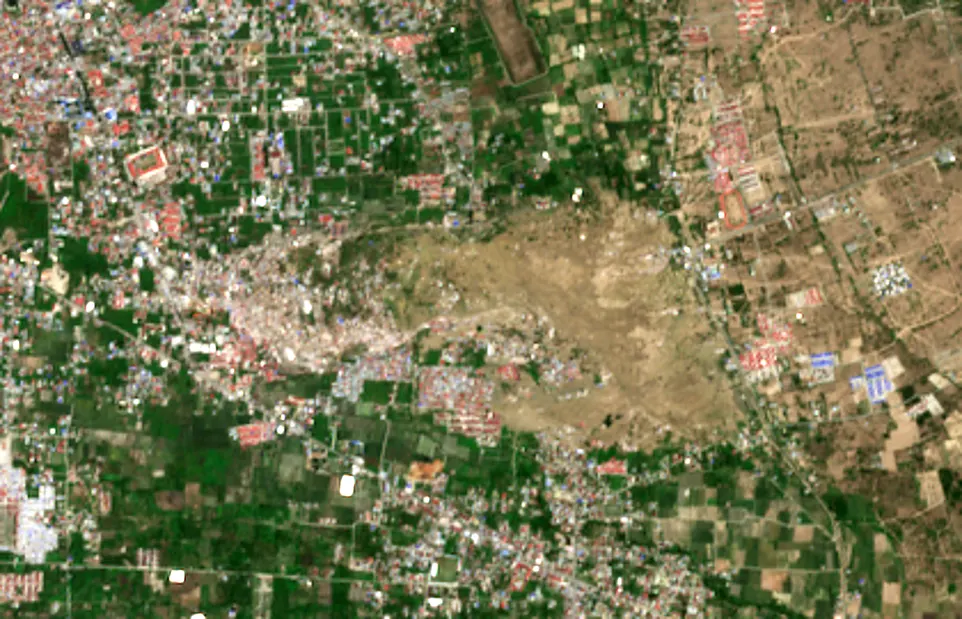
Sentinel-2 view of Petobo, Palu, on 27 September 2018, before the liquefaction.Sentinel-2 view of Petobo, Palu, on 2 October 2018, after the liquefaction.
  • BEFORE · 27 SEP 2018
  • AFTER · 2 OCT 2018
  • N ↑
  • 500 m

LIQUEFACTION · ±171 ha (screening)

Published estimates: ~180 ha (Kiyota et al. 2020)

Satellites read the surface. Geotechnics reads what lies beneath: soil layers, groundwater, and strength.

Contains modified Copernicus Sentinel data 2018

THE PROBLEM, IN NUMBERS

Liquefaction in Palu flowed on slopes of only 1 to 3 percent. Ground that looks safe can fail, and it can be measured before it does.

ITB study: Palu flow failures on 1 to 3% slopes